For feedback, use the following:
ipd_online_feedback@alcatel-lucent.com
Table of Contents Previous Next Index PDF


Event and Accounting Logs
In This Chapter
This chapter provides information about configuring event and accounting logs in the system.
Topics in this chapter include:
Logging Overview
The two primary types of logging supported in the OS are event logging and accounting logs.
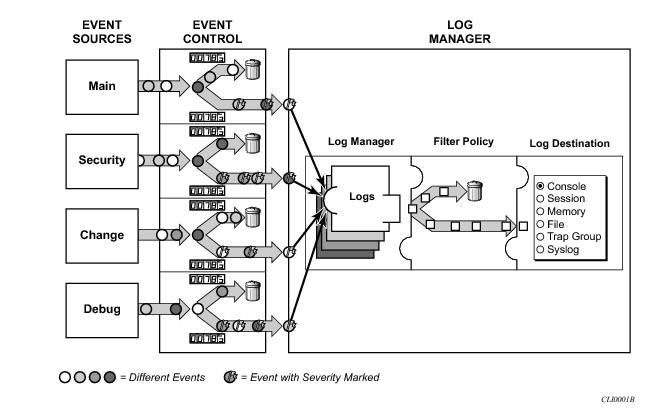
Event logging controls the generation, dissemination and recording of system events for monitoring status and troubleshooting faults within the system. The OS groups events into three major categories or event sources:
The following are events within the OS and have the following characteristics:
Event control assigns the severity for each application event and whether the event should be generated or suppressed. The severity numbers and severity names supported in the OS conform to ITU standards M.3100 X.733 & X.21 and are listed in Table 29.
Events that are suppressed by event control will not generate any event log entries. Event control maintains a count of the number of events generated (logged) and dropped (suppressed) for each application event. The severity of an application event can be configured in event control.
An event log within the OS associates the event sources with logging destinations. Examples of logging destinations include, the console session, a specific telnet or SSH session, memory logs, file destinations, SNMP trap groups and syslog destinations. A log filter policy can be associated with the event log to control which events will be logged in the event log based on combinations of application, severity, event ID range, VRF ID, and the subject of the event.
The OS accounting logs collect comprehensive accounting statistics to support a variety of billing models. The routers collect accounting data on services and network ports on a per-service class basis. In addition to gathering information critical for service billing, accounting records can be analyzed to provide insight about customer service trends for potential service revenue opportunities. Accounting statistics on network ports can be used to track link utilization and network traffic pattern trends. This information is valuable for traffic engineering and capacity planning within the network core.
Accounting statistics are collected according to the parameters defined within the context of an accounting policy. Accounting policies are applied to customer Service Access Points (SAPs) and network ports. Accounting statistics are collected by counters for individual service queues defined on the customer’s SAP or by the counters within forwarding class (FC) queues defined on the network ports.
The type of record defined within the accounting policy determines where a policy is applied, what statistics are collected and time interval at which to collect statistics.
The only supported destination for an accounting log is a compact flash system device (cf1or cf2). Accounting data is stored within a standard directory structure on the device in compressed XML format.
Log Destinations
Both event logs and accounting logs use a common mechanism for referencing a log destination. routers support the following log destinations:
Only a single log destination can be associated with an event log or with an accounting log. An event log can be associated with multiple event sources, but it can only have a single log destination.
A file destination is the only type of log destination that can be configured for an accounting log.
 
Console
Sending events to a console destination means the message will be sent to the system console The console device can be used as an event log destination.
 
Session
A session destination is a temporary log destination which directs entries to the active telnet or SSH session for the duration of the session. When the session is terminated, for example, when the user logs out, the event log is removed. Event logs configured with a session destination are not stored in the configuration file. Event logs can direct log entries to the session destination.
 
Memory Logs
A memory log is a circular buffer. When the log is full, the oldest entry in the log is replaced with the new entry. When a memory log is created, the specific number of entries it can hold can be specified, otherwise it will assume a default size. An event log can send entries to a memory log destination.
 
Log Files
Log files can be used by both event logs and accounting logs and are stored on the compact flash devices (specifically cf1: or cf2:) in the file system. It is recommended that event and accounting logs not be configured on the cf3: device that is used for software images and bootup configuration.
A log file is identified with a single log file ID, but a log file will generally be composed of a number individual files in the file system. A log file is configured with a rollover parameter, expressed in minutes, which represents the length of time an individual log file should be written to before a new file is created for the relevant log file ID. The rollover time is checked only when an update to the log is performed. Thus, complying to this rule is subject to the incoming rate of the data being logged. For example, if the rate is very low, the actual rollover time may be longer than the configured value.
The retention time for a log file specifies the amount of time the file should be retained on the system based on the creation date and time of the file.
When a log file is created, only the compact flash device for the log file is specified. Log files are created in specific subdirectories with standardized names depending on the type of information stored in the log file.
Event log files are always created in the \log directory on the specified compact flash device. The naming convention for event log files is:
log eeff-timestamp
where:
ee is the event log ID
ff is the log file destination ID
timestamp is the timestamp when the file is created in the form of yyyymmdd-hhmmss where:
yyyy is the four-digit year (for example, 2007)
mm is the two digit number representing the month (for example, 12 for December)
dd is the two digit number representing the day of the month (for example, 03 for the 3rd of the month)
hh is the two digit hour in a 24-hour clock (for example, 04 for 4 a.m.)
mm is the two digit minute (for example, 30 for 30 minutes past the hour)
ss is the two digit second (for example, 14 for 14 seconds)
 
Accounting log files are created in the \act-collect directory on a compact flash device (specifically cf1 or cf2). The naming convention for accounting log files is nearly the same as for log files except the prefix act is used instead of the prefix log. The naming convention for accounting logs is:
act aaff-timestamp.xml.gz
where:
aa is the accounting policy ID
ff is the log file destination ID
timestamp is the timestamp when the file is created in the form of yyyymmdd-hhmmss where:
yyyy is the four-digit year (for example, 2007)
mm is the two digit number representing the month (for example, 12 for December)
dd is the two digit number representing the day of the month (for example, 03 for the 3rd of the month)
hh is the two digit hour in a 24-hour clock (for example, 04 for 4 a.m.)
mm is the two digit minute (for example, 30 for 30 minutes past the hour)
ss is the two digit second (for example, 14 for 14 seconds)
Accounting logs are .xml files created in a compressed format and have a .gz extension.
The \act-collect directory is where active accounting logs are written. When an accounting log is rolled over, the active file is closed and archived in the \act directory before a new active accounting log file created in \act-collect.
 
SNMP Trap Group
An event log can be configured to send events to SNMP trap receivers by specifying an SNMP trap group destination.
An SNMP trap group can have multiple trap targets. Each trap target can have different operational parameters.
A trap destination has the following properties:
For SNMP traps that will be sent out-of-band through the Management Ethernet port on the SF/CPM, the source IP address of the trap is the IP interface address defined on the Management Ethernet port. For SNMP traps that will be sent in-band, the source IP address of the trap is the system IP address of the router.
Each trap target destination of a trap group receives the identical sequence of events as defined by the log ID and the associated sources and log filter applied.
 
Syslog
An event log can be configured to send events to one syslog destination. Syslog destinations have the following properties:
Because syslog uses eight severity levels whereas the router uses six internal severity levels, the severity levels are mapped to syslog severities. Table 30 displays the severity level mappings to syslog severities.
Event Logs
Event logs are the means of recording system generated events for later analysis. Events are messages generated by the system by applications or processes within the router.
Figure 7 depicts a function block diagram of event logging.
Figure 7: Event Logging Block Diagram
 
Event Sources
In Figure 7, the event sources are the main categories of events that feed the log manager.
Examples of applications within the system include IP, MPLS, OSPF, CLI, services, etc. The following example displays a partial sample of the show log applications command output which displays all applications.
*A:ALA-48# show log applications
==================================
Log Event Application Names
==================================
Application Name
----------------------------------
...
BGP
CCAG
CFLOWD
CHASSIS
...
MPLS
MSDP
NTP
...
TOD
USER
VRRP
VRTR
==================================
*A:ALA-48#


Event Control
Event control pre-processes the events generated by applications before the event is passed into the main event stream. Event control assigns a severity to application events and can either forward the event to the main event source or suppress the event. Suppressed events are counted in event control, but these events will not generate log entries as it never reaches the log manager.
Simple event throttling is another method of event control and is configured similarly to the generation and suppression options. See Simple Logger Event Throttling.
Events are assigned a default severity level in the system, but the application event severities can be changed by the user.
Application events contain an event number and description that explains why the event is generated. The event number is unique within an application, but the number can be duplicated in other applications.
The following example, generated by querying event control for application generated events, displays a partial list of event numbers and names.
router# show log event-control
=======================================================================
Log Events
=======================================================================
Application
ID# Event Name P g/s Logged Dropped
-----------------------------------------------------------------------
BGP:
2001 bgpEstablished MI gen 1 0
2002 bgpBackwardTransition WA gen 7 0
2003 tBgpMaxPrefix90 WA gen 0 0
...
CCAG:
CFLOWD:
2001 cflowdCreated MI gen 1 0
2002 cflowdCreateFailure MA gen 0 0
2003 cflowdDeleted MI gen 0 0
...
CHASSIS:
2001 cardFailure MA gen 0 0
2002 cardInserted MI gen 4 0
2003 cardRemoved MI gen 0 0
...
,,,
DEBUG:
L 2001 traceEvent MI gen 0 0
DOT1X:
FILTER:
2001 filterPBRPacketsDropped MI gen 0 0
IGMP:
2001 vRtrIgmpIfRxQueryVerMismatch WA gen 0 0
2002 vRtrIgmpIfCModeRxQueryMismatch WA gen 0 0
IGMP_SNOOPING:
IP:
L 2001 clearRTMError MI gen 0 0
L 2002 ipEtherBroadcast MI gen 0 0
L 2003 ipDuplicateAddress MI gen 0 0
...
ISIS:
2001 vRtrIsisDatabaseOverload WA gen 0 0
 
Log Manager and Event Logs
Events that are forwarded by event control are sent to the log manager. The log manager manages the event logs in the system and the relationships between the log sources, event logs and log destinations, and log filter policies.
An event log has the following properties:
The log ID is a short, numeric identifier for the event log. A maximum of ten logs can be configured at a time.
The source stream or streams to be sent to log destinations can be specified. The source must be identified before the destination can be specified. The events can be from the main event stream, events in the security event stream, or events in the user activity stream.
A log can only have a single destination. The destination for the log ID destination can be one of console, session, syslog, snmp-trap-group, memory, or a file on the local file system.
An event filter policy defines whether to forward or drop an event or trap-based on match criteria.
 
Event Filter Policies
The log manager uses event filter policies to allow fine control over which events are forwarded or dropped based on various criteria. Like other policies with the 7750 SR, filter policies have a default action. The default actions are either:
Filter policies also include a number of filter policy entries that are identified with an entry ID and define specific match criteria and a forward or drop action for the match criteria.
Each entry contains a combination of matching criteria that define the application, event number, router, severity, and subject conditions. The entry’s action determines how the packets should be treated if they have met the match criteria.
Entries are evaluated in order from the lowest to the highest entry ID. The first matching event is subject to the forward or drop action for that entry.
Valid operators are displayed in Table 31:
A match criteria entry can include combinations of:
 
Event Log Entries
Log entries that are forwarded to a destination are formatted in a way appropriate for the specific destination whether it be recorded to a file or sent as an SNMP trap, but log event entries have common elements or properties. All application generated events have the following properties:
 
The general format for an event in an event log with either a memory, console or file destination is as follows.
nnnn YYYY/MM/DD HH:MM:SS.SS <severity>:<application> # <event_id> <router-name> <subject> description
 
The following is an event log example:
475 2006/11/27 00:19:40.38 WARNING: SNMP #2007 Base 1/1/1 
"interface 1/1/1 came up" 
 
The specific elements that compose the general format are described in Table 32.
MM — Month
HH — Hours (24 hour format)
MM — Minutes
SS.SS — Seconds
CLEARED A cleared event (severity number 1).
INFO An indeterminate/informational severity event (severity level 2).
CRITICAL A critical severity event (severity level 3).
MAJOR A major severity event (severity level 4).
MINOR A minor severity event (severity level 5).
WARNING A warning severity event (severity 6).
 
Simple Logger Event Throttling
Simple event throttling provides a mechanism to protect event receivers from being overloaded when a scenario causes many events to be generated in a very short period of time. A throttling rate, # events/# seconds, can be configured. Specific event types can be configured to be throttled. Once the throttling event limit is exceeded in a throttling interval, any further events of that type cause the dropped events counter to be incremented. Dropped events counts are displayed by the show>log>event-control context. Events are dropped before being sent to one of the logger event collector tasks. There is no record of the details of the dropped events and therefore no way to retrieve event history data lost by this throttling method.
A particular event type can be generated by multiple managed objects within the system. At the point this throttling method is applied the logger application has no information about the managed object that generated the event and cannot distinguish between events generated by object "A" from events generated by object "B". If the events have the same event-id, they are throttled regardless of the managed object that generated them. It also does not know which events may eventually be logged to destination log-id <n> from events that will be logged to destination log-id <m>.
Throttle rate applies commonly to all event types. It is not configurable for a specific event-type.
A timer task checks for events dropped by throttling when the throttle interval expires. If any events have been dropped, a TIMETRA-SYSTEM-MIB::tmnxTrapDropped notification is sent.
 
Default System Log
Log 99 is a pre-configured memory-based log which logs events from the main event source (not security, debug, etc.). Log 99 exists by default.
The following example displays the log 99 configuration.
ALA-1>config>log# info detail
#------------------------------------------
echo "Log Configuration "
#------------------------------------------
...
        snmp-trap-group 7
        exit
...
        log-id 99
            description "Default system log"
            no filter
            from main
            to memory 500
            no shutdown
        exit
----------------------------------------------
ALA-1>config>log#
Accounting Logs
Before an accounting policy can be created a target log file must be created to collect the accounting records. The files are stored in system memory on compact flash (cf1: or cf2:) in a compressed (tar) XML format and can be retrieved using FTP or SCP.
A file ID can only be assigned to either one event log ID or one accounting log.
 
Accounting Records
An accounting policy must define a record name and collection interval. Only one record name can be configured per accounting policy. Also, a record name can only be used in one accounting policy.
The record name, sub-record types, and default collection period for service and network accounting policies are shown below. Table 35, Table 36, and Table 37 provide field descriptions.
 
When creating accounting policies, one service accounting policy and one network accounting policy can be defined as default. If statistics collection is enabled on a SAP or network port and no accounting policy is applied, then the respective default policy is used. If no default policy is defined, then no statistics are collected unless a specifically defined accounting policy is applied.
Each accounting record name is composed of one or more sub-records which is in turn composed of multiple fields.
Refer to the Application Assurance Statistics Fields Generated per Record table in the 7750 SR-Series OS Integrated Services Adapter Guide for fields names for Application Assurance records.
 
(*) For a SAP in AAL5 SDU mode, packet counters refer to the number of SDU.
(*) For a SAP in N-to-1 cell mode, packet counters refer to the number of cells.
(**) The number of octets in an ATM sap excludes the Header Error Control (HEC) byte, thus meaning each packet/cell has only 52 bytes instead of the usual 53.
(***) If override counters on the HSMDA are configured (see the 7750 SR Quality of Service Guide).
(****) Not used to identify stats from HSMDA due to MDA architecture. If the statistics are from HSMDA: apo, aoo else lpo/hpo, loo/hoo.
Table 35, Table 36, and Table 37 provide field descriptions.


Accounting Files
When a policy has been created and applied to a service or network port, the accounting file is stored on the compact flash in a compressed XML file format. The router creates two directories on the compact flash to store the files. The following output displays a directory named act-collect that holds accounting files that are open and actively collecting statistics. The directory named act stores the files that have been closed and are awaiting retrieval.
ALA-1>file cf1:\# dir act*
12/19/2006 06:08a      <DIR>          act-collect
12/19/2006 06:08a      <DIR>          act
 
ALA-1>file cf1:\act-collect\ # dir
Directory of cf1:\act-collect#
 
12/23/2006 01:46a      <DIR>          .
12/23/2006 12:47a      <DIR>          ..
12/23/2006 01:46a                 112 act1111-20031223-014658.xml.gz
12/23/2006 01:38a                 197 act1212-20031223-013800.xml.gz
Accounting files always have the prefix act followed by the accounting policy ID, log ID and timestamp. The accounting log file naming and log file destination properties like rollover and retention are discussed in more detail in Log Files.
 
Design Considerations
The router has ample resources to support large scale accounting policy deployments. When preparing for an accounting policy deployment, verify that data collection, file rollover, and file retention intervals are properly tuned for the amount of statistics to be collected.
If the accounting policy collection interval is too brief there may be insufficient time to store the data from all the services within the specified interval. If that is the case, some records may be lost or incomplete. Interval time, record types, and number of services using an accounting policy are all factors that should be considered when implementing accounting policies.
The rollover and retention intervals on the log files and the frequency of file retrieval must also be considered when designing accounting policy deployments. The amount of data stored depends on the type of record collected, the number of services that are collecting statistics, and the collection interval that is used. For example, with a 1GB CF and using the default collection interval, the system is expected to hold 48 hours worth of billing information.
 
Reporting and Time-Based Accounting
Node support for volume and time-based accounting concept provides an extra level of intelligence at the network element level in order to provide service models such as “prepaid access” in a scalable manner. This means that the network element gathers and stores per-subscriber accounting information and compare it with “pre-defined” quotas. Once a quota is exceeded, the pre-defined action (such as re-direction to a web portal or disconnect) is applied.
 
Overhead Reduction in Accounting: Custom Record
 
User Configurable Records
Users can define a collection of fields that make up a record. These records can be assigned to an accounting policy. These are user-defined records rather than being limited to pre-defined record types. The operator can select what queues and the counters within these queues that need to be collected. Refer to the predefined records containing a given field for XML field name of a custom record field.
 
Changed Statistics Only
A record is only generated if a significant change has occurred to the fields being written in a given the record. This capability applies to both ingress and egress records regardless on the method of delivery (such as RADIUS and XML). The capability also applies to Application Assurance records; however without an ability to specify different significant change values and per-field scope (for example, all fields of a custom record are collected if any activity was reported against any of the statistics that are part of the custom record).
 
Configurable Accounting Records
 
XML Accounting Files for Service and ESM-Based Accounting
The custom-record command in the config>log>accounting-policy context provide the flexibility to reduce the volume of data generated, network operators can define the record that needs to be collected. This can eliminate queues or selected counters within these queues that are not relevant for billing.
Record headers including information such as service-ID, SAP-ID, etc., will always be generated.
 
RADIUS Accounting in Networks Using ESM
The custom-record command in the config>subscr-mgmt>radius-accounting-policy context provide the flexibility to include individual counters in RADIUS accounting messages. See the CLI tree for commands and syntax.
Significant Change Only Reporting
Another way to decrease accounting messaging related to overhead is to include only “active” objects in a periodical reporting. An “active object” in this context is an object which has seen a “significant” change in corresponding counters. A significant change is defined in terms of a cumulative value (the sum of all reference counters).
This concept is applicable to all methods used for gathering accounting information, such as an XML file and RADIUS, as well as to all applications using accounting, such as service-acct, ESM-acct, and Application Assurance.
Accounting records are reported at the periodical intervals. This periodic reporting is extended with an internal filter which omits periodical updates for objects whose counter change experienced lower changes than a defined (configurable) threshold.
Specific to RADIUS accounting the significant-change command does not affect ACCT-STOP messages. ACCT-STOP messages will be always sent, regardless the amount of change of the corresponding host.
For Application Assurance records, a significant change of 1 in any field of a customized record (send a record if any field changed) is supported. When configured, if any statistic field records activity, an accounting record containing all fields will be collected.


Immediate Completion of Records
 
Record Completion for XML Accounting
For ESM RADIUS accounting, an accounting stop message is sent when :
A similar concept is also used for XML accounting. In case the accounted object is deleted or changed, the latest information will be written in the XML file with a “final” tag indication in the record header.
 
AA Accounting per Forwarding Class
This feature allows the operator to report on protocol/application/app-group volume usage per forwarding class by adding a bitmap information representing the observed FC in the XML accounting files.
Configuration Notes
This section describes logging configuration caveats.
 
A file ID can only be assigned to either one log ID or one accounting policy.
Accounting policies must be configured in the config>log context before they can be applied to a service SAP or service interface, or applied to a network port.
The snmp-trap-id must be the same as the log-id.